Tuesday, December 3

Option Play for Nvidia (NVDA)

Posted by Unknown
Today's play is debit call spread on NVDA. The stock is set for new upward move along with other Nasdaq stocks such as APPL, ARMH, QCOM and AMD.

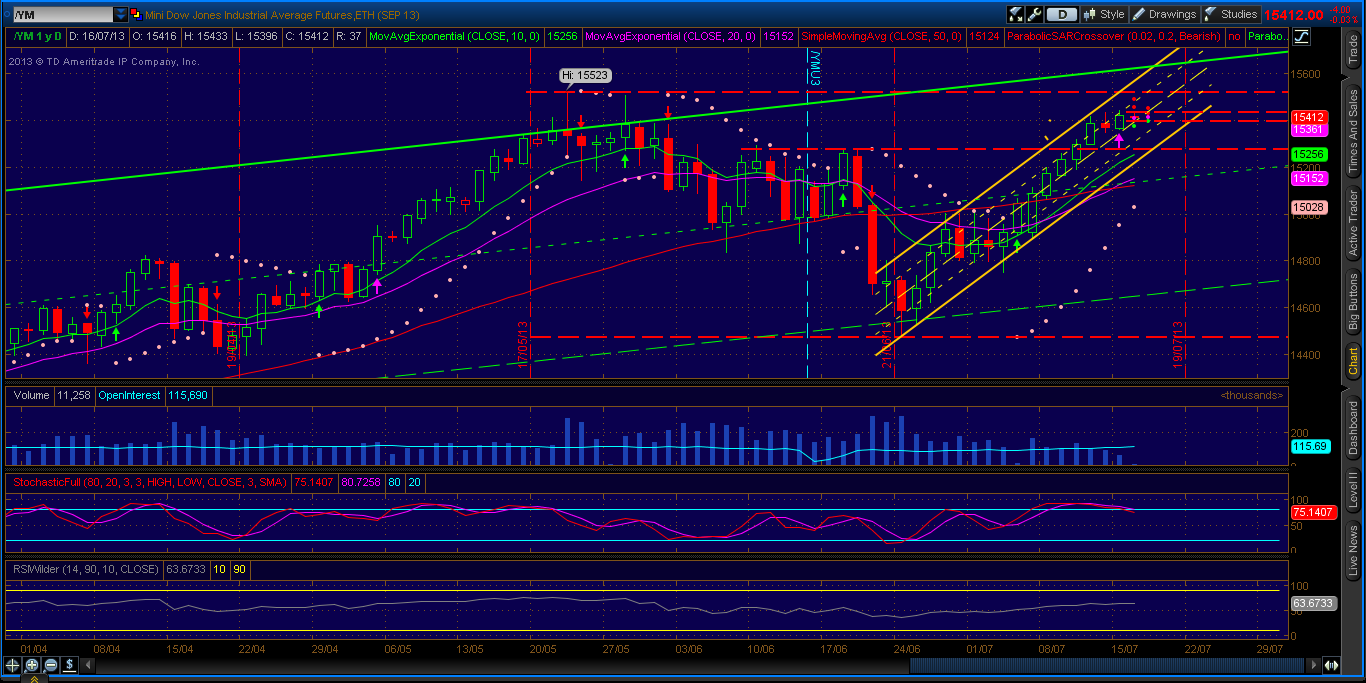
Price and moving averages all in line and set to provide good base and support around $15.20 level.


Target:
Six months: 18.96     One year: 22.14
Support:
Support1: 15.12    Support2: 14.44
Resistance:
Resistance1: 16.23    Resistance2: 18.96
Pivot:
15.64
Moving Averages:
MA(5): 15.64     MA(20): 15.44
MA(100): 15.09     MA(250): 13.78
MACD:
MACD(12,26): 0.08     Signal(12,26,9): 0.06
%K %D:
%K(14,3): 59.97     %D(3): 63.18
RSI:
RSI(14): 56.06
52-Week:
High: 16.23  Low: 11.53  Change(%): 33.0
Average Vol(K):
3-Month: 6953  10-Days 6933


If in coming days stock price manages to take out Parabolic SAR we will be looking to BUY:
 
                                         10 contracts of   NVDA FEB14  17/18 Call Spread @ $0.18
 
 
So the cost for the spread is $180 + $30 commission, which amount to $210. The break even at expiration is at $17.18,  and if the price sets above $18 we will get the maximum profit of $820.


Read More
Ideas From Tradeview

Tuesday, July 16

market outlook for dow jones futures and emini S&P 16 july

Posted by Unknown
Read More

Daily analysis for Dow Jones futures and Emini S&P futures for 16/072013

Posted by Unknown
This week quite few earnings reporting, today was from Goldman Sachs who beat estimates. While big banks delivered better then expected profits other areas were not strong at all. Also there was CPI data which showed inflation is a little bit higher then expected with plus 0.5%  in June.
This week investors will be mainly focused on Bernake semi annual report of monetary policy and everyone is hoping to get further clarification on  when and how tapper will happen.

Futures this morning were flat or slightly up and down in the asian session. Please have a look first at Dow Jones futures charts on weekly, daily and hourly timeframe:


As you can see on weekly chart there is clear uptrend and at the moment trading at the top of the upward channel and also ParaboliSAR was taken out which is a buying signal, but for me the time is not right as i will wait to pull back to 15300 level before i get into if stochastics stay above 80 level on daily chart and dont cross down. Also on daily chart 20 ema just crossed above 50dma which is confirmation of uptrend, but everything has to be taken with precautions as this week market mover is Bernake speach and data that are influencing his policy as inflation and employment. 

If i take position today it will be for very short period of maybe few hours and will enter on confirmend breakout od daily high of 15400 and daily low of 15396. Target price is pivot R1 or pivot S1 respectively.

Emini S&P futures have similar chart as dow jones and will stay away trading it today, and wait for pullback to 1650 if it come to entrer long.


Read More